Standard Curve
ELISA Data Reduction: How to generate a standard curve.
If software capable of generating a 4-Parameter Logistic curve fit is unavailable, a standard curve using linear regression analysis in excel can be used.
Entering Data into Microsoft Excel
|
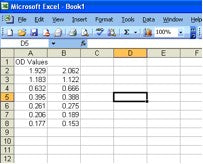
Step 1. After Optical Densities (ODs) have been collected, enter each standard OD into a worksheet as shown. |
 |
|
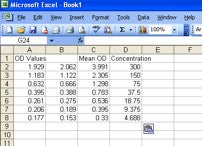
Step 2. Take the averages of the duplicate values either by adding them up and dividing by two on a calculator, or entering the formula =AVERAGE(A2;B2). Note: change the cell location from A2 and B2 to the desired cell location of each Standard OD. |
 |
|
Step 3. Enter the Standard concentrations that each OD should represent next to their corresponding OD average. |
|
Creating a Standard Curve
|
Step 1. Highlight your data range and click on the "Chart Wizard" icon in the excel tool bar. |
 |
|
Step 2. Choose XY (Scatter) and click "Next" |
 |
|
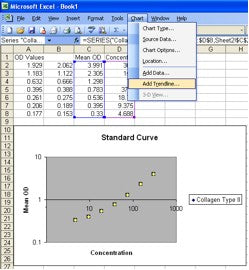
Step 3. Click on "Series" located at the top of the Chart Wizard Window.
|
 |
|
Step 4. Add information to your chart such as titles and axis labels. Once you customize the chart to your preferences, click "Next". |
 |
|
Step 5. Place your chart on a new Excel sheet or insert into your current worksheet. |
 |
|
Step 6. Double click on the x-acis values and a "Format Axis" window will pop up. Click on the "Scale" tab on the top of the window. Check the "logarithmic scale" box. |
 |
|
Step 7. Do the same to the y-axis |
 |
|
Step 8. Highlight data points by clicking on one of them. Click on the "Chart" tab and on the top menu bar click on "Add Trendline". |
 |
|
Step 9. A "Add Trendline" window will appear. Select Linear under "Trend/Regression type". |
 |
|
Step 10. Go to the "Options" tab on the top of the window and Select "Display equation on chart" and "Display R-squared value on chart" |
 |
|
Step 11. Click "OK" to view your chart with equations. |

|
Analyzing Data
|
Now that you have your equation, you can solve for "x" and enter your sample OD values as Y. You can do this by using a calculator and manually solving for "X" or by inputting a formula as shown. Use Excel Equation: y=0.062x+0.1579 Enter Formula: =(G7-0.1579)/0.0062) where G7 is your OD value (select the appropriate cell for your data) |
 |
Note: Linear regression on Excel should only be used if software that can create a 4-Parameter (4-PL) logistic curve fit is unavailable. Please keep in mind that values that are represented at the low end of your curve will not be as reliable as values at the higher end of your curve.
Sample Data comparing standard curve values using 4-PL vs Linear regression.
| Concentration (ng/mL) | Mean OD | 4-PL (ng/mL) | Linear regression (ng/mL) |
| 300 | 1.996 | 300.05 | 296.44 |
| 150 | 1.153 | 150.42 | 160.47 |
| 75 | 0.649 | 74.33 | 79.18 |
| 37.5 | 0.392 | 37.46 | 37.73 |
| 18.75 | 0.268 | 19.72 | 17.73 |
| 9.38 | 0.198 | 9.26 | 6.44 |
| 4.69 | 0.165 | 4.15 | 1.11 |